Overview
This application is in alpha or early beta-testing. It is not currently to be used for any real-world application.
This application provides hydrologically-relevant data to help dam practitioners in Oregon with dam management, design, and maintenance. The data may also prove helpful for many other uses.
Specific types of data available include:
- Point estimates of precipitation frequency
- Areal estimates of precipitation frequency
- Information about storm temporal distribution in target area
- Information about storm spatial distribution in target area
- Summary of land use types
- Wildfire history
- Soil hydrologic group information
- Historical snow and snow-water-equivalent information(SWE)
- General guidance on how to use these data for a user's dam of interest
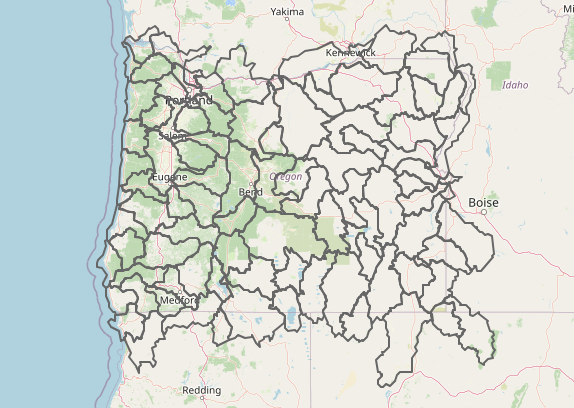
If your project falls within the below boundaries you may find this tool helpful.
This application was developed by WEST Consultants, Inc., on behalf of and in cooperation with the Oregon Water Resources Department.
Instructions
The Analysis tab serves as the engine of the web application. To explore existing data or obtain custom results for an area of interest, simply navigate through its steps.
Data Explorer
- Go to Analysis and navigate to the Data Explorer tab
- Click on the button with a green boundary in the lower-right corner of the map.
-
Select what type of existing data you'd like explore.
- Observed temporal distributions of large storms from gauges across the state.
- Precipitation return levels (i.e., precipitation depths associatd with different annual exceedence probabilities) for basins under 10 square miles (sqmi.)
- Precipitation return levels for basins greater than 10 sqmi.
- If present, select options regarding your scenario (e.g., storm duration).
- Select the icons or polygons in the map to see existing results.
- Show results as a table and/or save the tabular results using the two buttons below the plot.
-
Use the report buttons below the plot area to view precipitation, basin attribute, or guidance reports.
WARNING: Not functional.
(or click here)
Tab 2. Data Creator
- Go to Analysis and navigate to the Data Creator tab
- Provide a latitude/longitude or upload geospatial data to define a new area of interest.
-
Select the precipitation options and any basin-attribute retrieval you want, then click "Retrieve Data".
WARNING: Not functional.
(or click here)
Interacting with plots.
Plots are interactive.
- You can zoom and pan by using the mouse directly in the plot.
- Various components of the graph can be turned on or off by clicking or double clicking on them in the plot or in the legend.
-
In the upper right corner of any plot you will also see many buttons appear when hovering
over the plot. With these buttons you can:
- Download the figure as a .png file
- Zoom and pan
- Reset axes.
Methods Descriptions
-
Overview
Historically, areal precipitaiton estimates (i.e., depths across some area opposed to depths at a point) have been calculated by developing point estimates then using a Depth Area Reduction Factor to reduce that point-depth to account for the spread across the area of interest.
That approach has many shortcomings. To overcome those shortcomings this work applied Max-Stable Process models (MSP) to estimate areal precipitations depths. MSPs:- Are the infinite-dimensional extension of extreme-value theory,
- Account for spatial dependence in precipitation - acknowleding that some locations near each other may experience co-occurence of maxima, whereas locations farther away may not,
- Account for the impact of explanatory variables, such as topography, on the magnitude of maxima,
- Readily provide areal estimates of precipitation depth.
For basins larger than 10 mi2, MSP models were applied. For basins smaller than 10mi2, point estimates were applied. -
Observed Rainfall Collection
An extensive database of precipitation gauge data has been collected and quality controlled for various storm durations ranging from hourly to weekly.
-
Collecting Covariates
Gridded datasets representing over 80 variables that may define spatial variation of precipitation return levels have been collected. From those variables, model covariates were identified by removing multicollinearity and then applying lasso regression.
-
Identifying Anisotropy in Precipitation Extremes
A potentially important consideration in MSP models is anisotropy, where spatial dependence is stronger in one direction compared to other directions. To identify if anisotropy was present in our modeling domain and to identify regions with different spatial dependence structures, a matrix transformation, that rotates and scales the input data, was applied to three potential regions of application: (1) west of the Cascade Mountain range, (2) east of the Cascade Mountain range, and (3) the entire state. By performing a grid search on angles of rotation and scaling factors, the optimal transformation was identified as the one that minimized Takeuchi’s Information Criterion.
-
Precipitation Frequency Results
Next steps in this ongoing work are to fit MSP models for all durations of interest using bootstrap sampling across years of record. Those models will then be used to estimate areal-based return levels from 1 to 100,000 years and 95% confidence intervals. Results will be used across Oregon to improve dam design and management.
-
Other Data
Add description of other data sources/methods here.
Future Features
-
Suggested adjustments to account for climate change
-
Updated guidance for application and use of Probable Maximum Precipitation
-
Guidance on hydrological modeling for a user's use case
-
Ability to calculate point and areal estimates of precipitaiton frequency for custom domains
Contact
Benjamin Choat, Project Engineer, WEST Consultants, Inc.
Email: bchoat@westconsultants.com